
 The Index of Opposition Unity (IOU) is a term used in Indian politics to measure the level of unity or fragmentation among opposition parties during elections. It is a quantitative indicator that helps assess the strength or weakness of the opposition coalition or alliance as compared to the ruling party or coalition.
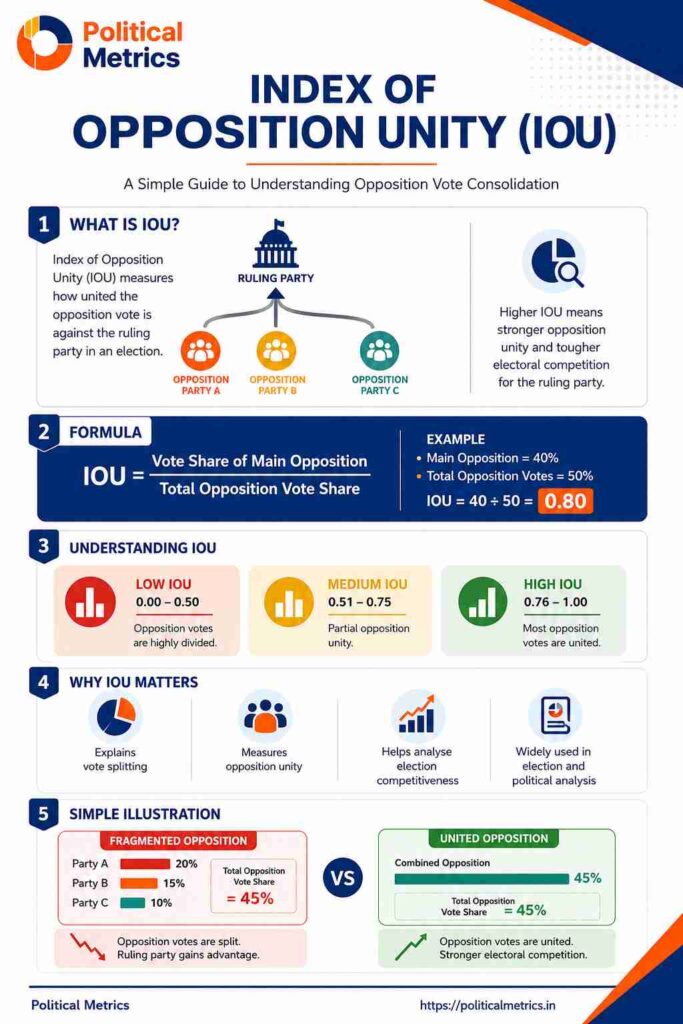
The formula to calculate the Index of Opposition Unity in India is as follows:
✅ Formula
What is the Index of Opposition Unity (IOU)?
The IOU shows how much of the opposition vote went to the main challenger as compared to the total opposition votes.
It helps to explain why a ruling party can win even when its vote share is below 50%.
IOU = (Vote share of main opposition party) ÷
    (Sum of vote shares of all opposition parties)
If IOU is close to 1.0, it means the opposition is united.
If IOU is low (like 0.3–0.5), it means the opposition is divided.
The concept of the Index of Opposition Unity gains particular significance in India’s multi-party system, where numerous regional and national parties play crucial roles in elections. It is especially relevant during parliamentary elections, where seat-sharing arrangements and alliances among parties can significantly influence the final electoral outcome.
It is essential to note that the calculation of the Index of Opposition Unity may vary depending on the specific methodologies used by political analysts and researchers. While the IOU serves as a valuable tool to analyze the dynamics of electoral politics in India, it should be considered alongside other relevant factors to gain a comprehensive understanding of the political landscape.
Case Study 1
Andhra Pradesh Assembly Elections 2019: Index of Opposition Unity (IOU) Explained
The Index of Opposition Unity (IOU) is a political measure that shows how united or divided the opposition was during an election.
This case study uses the 2019 Andhra Pradesh Assembly elections to explain how vote splits affected the outcome under the First Past The Post (FPTP) syst
📘 What is the Index of Opposition Unity (IOU)?
The IOU shows how much of the opposition vote went to the main challenger as compared to the total opposition votes.
It helps to explain why a ruling party can win even when its vote share is below 50%.
IOU = (Vote share of main opposition party) ÷
      (Sum of vote shares of all opposition parties)
If IOU is close to 1.0, it means the opposition is united.
If IOU is low (like 0.3–0.5), it means the opposition is divided.
🗳️ Andhra Pradesh 2019 Election Results — Vote Shares
| Party | Vote Share (%) | Seats Won |
|---|---|---|
| YSR Congress Party (YSRCP) | 49.95% | 151 |
| Telugu Desam Party (TDP) | 39.17% | 23 |
| Jana Sena Party (JSP) | 5.53% | 1 |
| Bharatiya Janata Party (BJP) | 0.84% | 0 |
| Indian National Congress (INC) | 1.17% | 0 |
| Others / Independents | 3.34% | 0 |
Source: Election Commission of India, 2019
⚙️ Step-by-Step IOU Calculation
- Main Opposition Party: Telugu Desam Party (TDP) = 39.17%
- Other Opposition Parties: JSP 5.53% + BJP 0.84% + INC 1.17% + Others 3.34% = 10.88%
Total Opposition Vote = 39.17 + 10.88 = 50.05%
IOU = 39.17 ÷ 50.05 = 0.783 (≈ 78%)
✅ IOU = 0.78 means that 78% of opposition votes went to TDP, while 22% went to smaller parties like Jana Sena, BJP, and Congress.
📈 What Does This IOU Mean?
- Moderately high unity: IOU ≈ 0.78 shows the opposition was largely behind TDP, but not fully united.
- Vote Split Effect: 5–6% votes went to smaller parties, allowing YSRCP to win many close contests.
- YSRCP Victory: Even with 49.95% vote share, YSRCP won 151/175 seats due to FPTP system.
In a bipolar contest, even small splits of 3–5% can change 50+ seat outcomes.
💡 What If TDP and Jana Sena Had Allied?
If TDP (39.17%) and Jana Sena (5.53%) had formed a pre-poll alliance:
Combined Vote Share = 39.17 + 5.53 = 44.70%
IOU (new) = 44.70 ÷ 50.05 = 0.89
With an IOU of 0.89, the opposition would have been much more united.
This could have turned the election into a close fight in at least 40–50 constituencies.
Under India’s FPTP system, even a small increase in IOU can significantly boost seat conversion efficiency.
📊 Summary of Findings
| Metric | Value |
|---|---|
| Total Opposition Vote | 50.05% |
| Main Opposition (TDP) | 39.17% |
| IOU | 0.78 |
| Winner | YSRCP (49.95%) |
| Observation | Opposition slightly divided — YSRCP gained due to FPTP system. |
🧠 Key Insights
- Opposition (50.05%) had slightly more votes than YSRCP (49.95%), but division helped YSRCP sweep.
- IOU of 0.78 indicates medium-high unity, but not full consolidation.
- In FPTP systems, vote unity > total vote share.
- Alliances improve efficiency — higher IOU leads to better seat conversion.
📘 Conclusion
The 2019 Andhra Pradesh Assembly election shows how even a small amount of opposition fragmentation can
cause a ruling party to win big. Although TDP had most of the opposition votes,
the remaining 22% split across smaller parties prevented a closer contest.
This case proves that under India’s FPTP system, unity matters more than numbers.
A higher IOU can convert public support into real seats.
📚 Quick Reference: IOU Scale
| IOU Range | Interpretation |
|---|---|
| 0.0 – 0.4 | Low IOU – Highly Fragmented Opposition |
| 0.4 – 0.7 | Medium IOU – Partial Unity |
| 0.7 – 1.0 | High IOU – Bipolar Contest |
Case Study 2
2014 Lok Sabha Elections: Index of Opposition Unity (IOU)
The Index of Opposition Unity (IOU) explains how united or divided the opposition was in the
2014 Lok Sabha elections. A low IOU means the opposition vote was scattered across many parties.
Under India’s First-Past-the-Post system, this split helped the winner convert votes into a large seat tally.
📘 IOU Formula (Simple)
IOU = (Vote share of main opposition) ÷
      (Total opposition vote share)
Higher IOU (closer to 1.0) = opposition is united behind one challenger.
Lower IOU (closer to 0.0) = opposition is fragmented across many parties.
🗳️ National Results Snapshot (Party Level)
(Key parties shown for clarity)
| Party | Vote Share (%) | Seats Won |
|---|---|---|
| BJP | 31.0% | 282 |
| Indian National Congress (INC) | 19.3% | 44 |
| All India Trinamool Congress (TMC) | 3.8% | 34 |
| AIADMK | 3.3% | 37 |
| Bahujan Samaj Party (BSP) | 4.1% | 0 |
| Samajwadi Party (SP) | 3.4% | 5 |
| Left Parties (CPI(M)+CPI) | ~4.0% | 12 |
| Biju Janata Dal (BJD) | 1.7% | 20 |
| Telangana Rashtra Samithi (TRS) | 1.2% | 11 |
| Others / Regionals | ~28.2% | — |
Totals rounded for readability.
⚙️ IOU Calculation — Party Level
- Winner (Ruling after election): BJP (31.0%)
- Main Opposition (party-level): INC = 19.3%
- Total Opposition Vote (party-level): 100 − 31.0 = 69.0%
IOU (party-level) = 19.3 ÷ 69.0 = 0.28 (≈ 28%)
✅ IOU ≈ 0.28 means only 28% of opposition votes went to the main challenger (INC), while 72% were spread among many other parties (TMC, AIADMK, BSP, SP, Left, BJD, TRS, etc.).
This is a textbook case of a highly fragmented opposition.
🤝 Alliance Reality — Why Alliances Matter
India votes in alliances. Looking at blocs gives a clearer picture of unity.
| Alliance | Vote Share (%) | Seats Won |
|---|---|---|
| NDA (BJP-led) | 38.5% | 336 |
| UPA (INC-led) | 23.0% | 59 |
| AIADMK (TN) | 3.3% | 37 |
| TMC (WB) | 3.8% | 34 |
| Left Front | ~4.0% | 12 |
| BJD (Odisha) | 1.7% | 20 |
| TRS (Telangana) | 1.2% | 11 |
| Others / Regionals | ~24.5% | — |
- Total Opposition Vote (alliance-level): 100 − 38.5 = 61.5%
- Main Opposition Alliance: UPA = 23.0%
IOU (alliance-level) = 23.0 ÷ 61.5 = 0.37 (≈ 37%)
✅ Even at the alliance level, IOU ≈ 0.37 is low. Most opposition votes were not rallied behind a single national challenger to NDA.
📈 What Low IOU Did in 2014
- Seat Conversion: NDA turned 38.5% votes into 336 seats because opposition votes were split across many parties.
- Multi-cornered Contests: In dozens of seats, BJP won with 35–40% votes while the rest was divided.
- Weak National Pole: INC was not a strong magnet for anti-NDA votes; regionals fought on their own turf.
🔍 Illustrative Constituency Pattern (Typical 2014 multi-cornered race)
BJP (NDA): 38%
INC (UPA): 26%
Regional A: 14%
Regional B: 12%
Others: 10%

Winner: BJP with 38% (opposition split 62% among many parties)
🧠 IOU Scale (Quick Reference)
| IOU Range | Interpretation | Implication |
|---|---|---|
| 0.0 – 0.4 | Low IOU (Fragmented) | Ruling side gains big |
| 0.4 – 0.7 | Medium IOU (Partial Unity) | Competitive but split hurts |
| 0.7 – 1.0 | High IOU (United) | Bipolar, tight contests |
💡 Key Takeaways
- 2014 had Low IOU — 0.28 (party-level) and 0.37 (alliance-level).
- Opposition fragmentation allowed a vote-seat surge for NDA.
- Alliances and pre-poll coordination are critical to raise IOU and improve seat conversion.
Written by: Kalyan Chandra | Political Data & Campaign Analytics

Kalyan Chandra
Kalyan chandra is a political strategist, media and communication consultant with the expertise in public relations, marketing, political research, election campaign management, psephology and digital analytics. He focuses on strategic political consulting, offering services that include competitive research, public opinion collection, and digital media management. Kalyan has significantly contributed to successful campaigns across India with his meticulous approach and deep understanding of the political landscape.